KOBIL Solutions
Overview
You can use MasterController SDK with different KOBIL solutions. Except of the IDP functionality ('Single Sign On'), all solutions provide the same functionality for the app. The usage of the MasterController differs a little bit, this is described in this documentation and the GettingStartedApps. The used server installation defines the used solution for the app. KOBIL recommends to use KOBIL Shift Lite.
| Solution | Security Server | Description |
|---|---|---|
| KOBIL Digitanium | SSMS | Basic solution for up to 10 million user |
| Pin Login with SSMS | ||
| Push Notification is triggered by SSMS | ||
| Management via SSMS WebUI | ||
| KOBIL Digitanium+ | SSMS with KOBIL IDP | Basic solution extended with limited IDP functionality |
| IDP-Token Login with SSMS | ||
| Push Notification is triggered by SSMS | ||
| Management via SSMS WebUI and KOBIL IDP WebUI | ||
| KOBIL Shift Lite | AST Services with KOBIL IDP | Modern high scalable solution with full IDP functionality |
| IDP-Token Login with AST Services | ||
| Push Notification is triggered by SCP Notifier service | ||
| Management via Portal/Dashboard and KOBIL IDP WebUI |
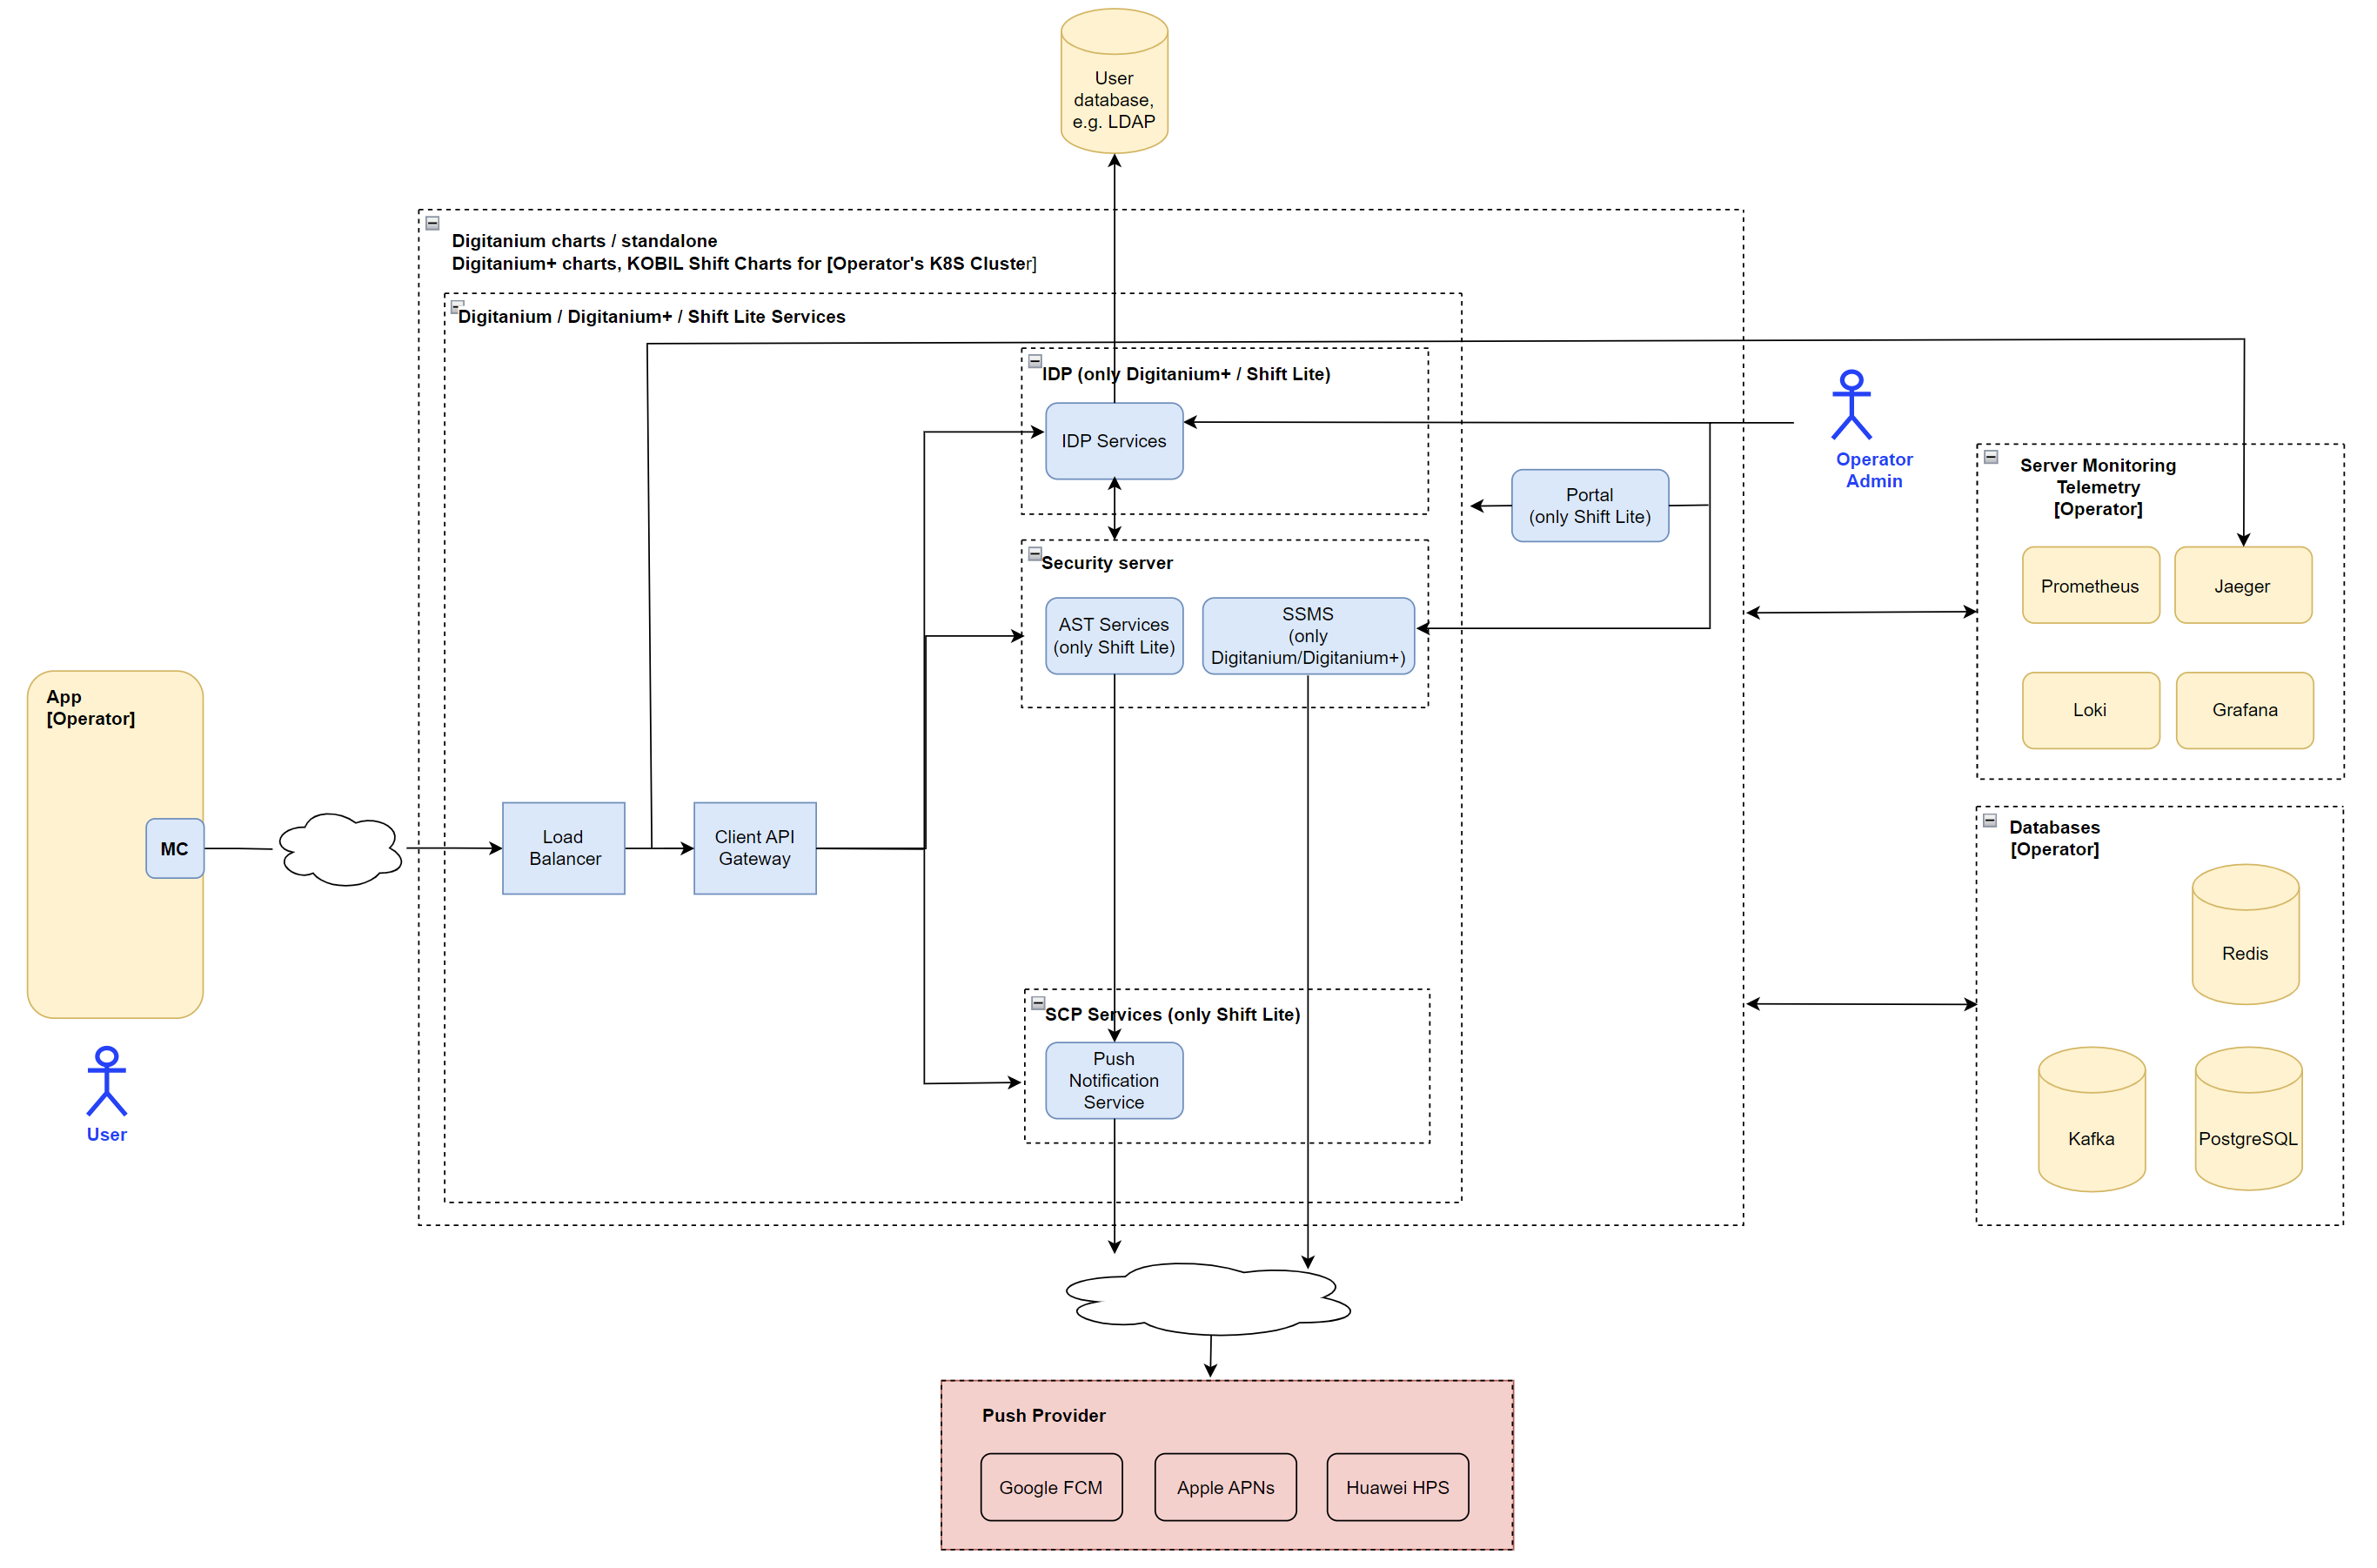
For all solutions we recommend to provide and use distributed tracing (e.g. using "Jaeger"), see the description of how to enable tracing in the application. Server Monitoring with various tools like "Grafana" is another useful thing that we recommend to set up.
So, a fully featured solution might look like this:
KOBIL IDP WebUI
This is a Web UI where you can add and delete users, assign and manage roles and work on various other tasks.
Portal (aka Dashboard)
This is a role based Web UI responsible for the management and monitoring tasks related to a each specific tenant. For example you can
- add apps and register app versions,
- manage users, e.g. lock a user or a user device.
- look at statistics and reports collected by the system.
Server Monitoring
Here, a service regularly observes the activity of the services, to detect and alarm if problems arise such as
- a service in not available any more
- a service performance is too slow.
Our standard installation uses the following services:
- "Loki" to store service logs
- "Prometheus" to receive service statistics
- "Grafana" for the web based visualization of the current state.
Distributed Tracing
This is a intended to collect and visualize distributed traces of different client-side apps and the server-side services. Data is stored e.g. in a "Jaeger" installation and visualized e.g. with a "Grafana" installation. The data is used to
- visualize how User requests flow across services
- rapidly perform deep root cause analysis
- analyze latency across a distributed set of services.