Shift Metrics - Monitoring
Shift Metrics - Monitoring
The implementation for the KOBIL Shift services metrics (and endpoints per related service) is part of the default KOBIL Shift functionality. The KOBIL Charts covers implementation to create Prometheus style "serviceMonitor" CRD. Using the Prometheus Operator CRD "servicemonitors.monitoring.coreos.com" is supported by KOBIL Shift deployment to create appropriate servicemonitors per KOBIL Shift service. The servicemonitor object is a resource then describing which metrics endpoints are available and how to scrape.
Enable the ServiceMonitors
The KOBIL Services are providing Prometheus Metrics per specific
Endpoints which are enabled by default. Use in KOBIL Shift
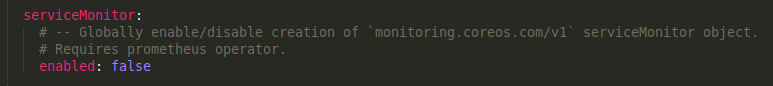
metaconfiguration file "values.yaml" the "global" section find
"serviceMonitor" section and enabled: true to get CRD
"serviceMonitor" created during deployment.
This will create the "servicemonitor" CRD objects in the KOBIL Shift namespace.
Access to the Prometheus compatible metrics (ports)
-
external access / exposing (not implemented by default in KOBIL Shift Charts - not exposed via ingress/ingress-controller)
-
internal access from pods metrics endpoints
The services metrics created for the KOBIL Shift Services are available by default with (Note: metrics endpoints are not exposted via Ingress):
| Service | Port | Path | Comment |
|---|---|---|---|
| ast-client-properties | 8080 | /metrics | AST service metrics |
| ast-localization | 8080 | /metrics | AST service metrics |
| ast-stream | 8080 | /metrics | AST service metrics |
| ast-tms | 8080 | /metrics | AST service metrics |
| ast-version | 8080 | /metrics | AST service metrics |
| ast-webhooks | 8080 | /metrics | AST service metrics |
| astca | 8080 | /metrics | AST service metrics |
| astclientmanagement | 8080 | /metrics | AST service metrics |
| astcpb | 8080 | /metrics | AST service metrics |
| astlogin | 8080 | /metrics | AST service metrics |
| idp-core | 8080 | /auth/realms/master/metrics | Metrics in IDP (keycloak) per realm possible (enable them - see below) |
| idp-core-wildfly | wildfly | /metrics | basic wildfly keycloak metrics |
| scp-addressbook | http | /addressbook/metrics | SCP service metrics |
| scp-gateway | http | /gateway/metrics | SCP service metrics |
| scp-media | http | /media/metrics | SCP service metrics |
| scp-messenger | http | /messenger/metrics | SCP service metrics |
| scp-presence | http | /presence/metrics | SCP service metrics |
| smartscreendashboard | 8080 | /metrics | SMART services metrics |
| smartscreenfrontend | 8080 | /metrics | SMART services metrics |
| smartscreensearch | 8080 | /metrics | SMART services metrics |
| smartscreenservices | 8080 | /metrics | SMART services metrics |
| shift-operator | http | /metrics | Shift Operator metrics |
Notes:
Defined in the KOBIL Shift meta-configuration (values.yaml) find the
ServiceMonitor declaration and set to global.serviceMonitor.enabled:true - which will then create the
ServiceMonitor objects in the target namespace. The created ServiceMonitor objects are in sync with Prometheus Operator Layout and
will allow discovery.
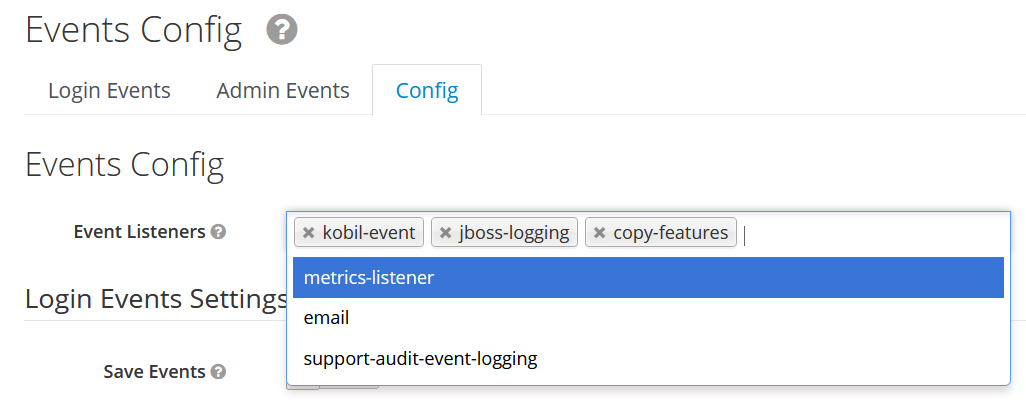
Metrics must be enabled in Keycloak separately for each tenant/realm. For this in the Admin UI, go to Events->Config->Event Listeners and select metrics-listener per realm. The IDP-core metric endpoint will then cover all enabled realm metrics under the hood of the "master" endpoint - "/auth/realms/master/metrics".
When the KOBIL Shift Charts "serviceMonitor" is enabled, the default CRD templates
from the KOBIL Shift Chart package is used.
Currently the default CRD "serviceMonitor" objects are related to default prometheus configuration.
In case of specific Prometheus configuration at customer environment, the default "serviceMonitor" obejcts
create by KOBIL Shift deployment may require modification. Or customer can disable the
serviceMonitor creation and create its own serviceMonitor objects in the namespace.
For this you may use the KOBIL provided CRD serviceMonitor templates as a sample.
It is possible to make use of native "curl"-request to receive all TYPE declarations per service.